


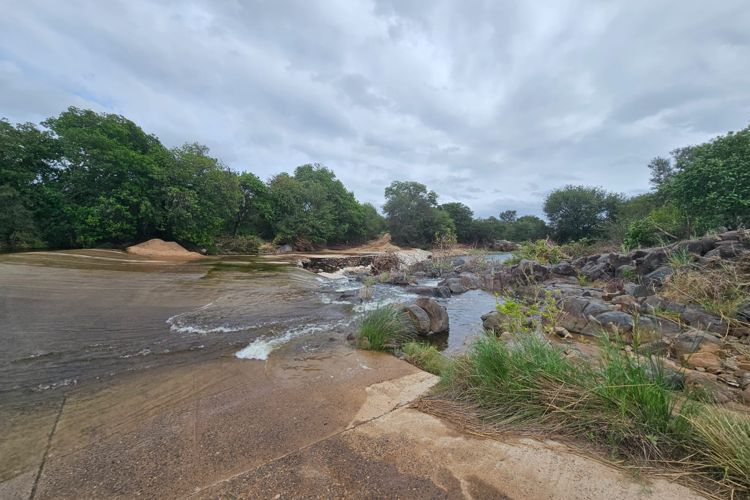
The 25/26 rainfall season has ended. It ran from July 2025 to June 2026.
As we enter the new 2026/2027 rainfall season, it is fitting to delve deeper into the highly unusual rainfall experienced during the past year, and how this has affected long-term average rainfall data. Please see Table 1 below, summarising rainfall over the past twelve months, the historical average rainfall including the most recent rainfall season, the historical average rainfall excluding the recently completed rainfall season, and indicator of resultant historical change:
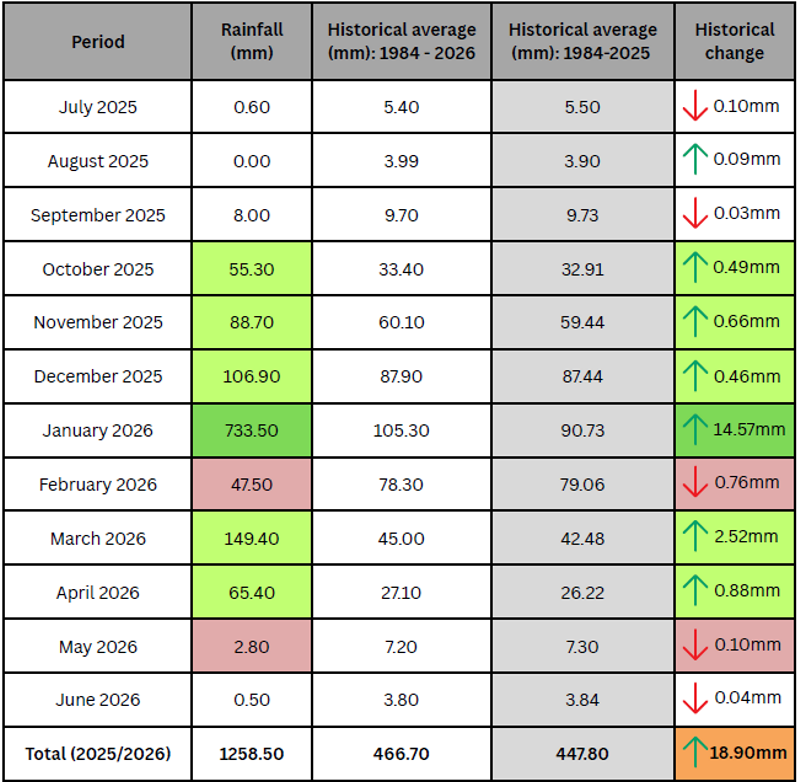 2025/2026 monthly and annual rainfall figures as compared to historical average figures inclusive of and exclusive of the most recent season, and the overall resultant changes.
Indicated in green and red cell blocks are months during which monthly rainfall was either vastly above or below historical averages for those months, thus having a significant impact on the annual historical average rainfall for Ingwelala. As can be seen in the orange cell block above, the annual historical average rainfall has increased by 18.90mm within the past year, and this is a direct result of the immense rainfall measured over the span of only six months.
The annual rainfall recorded in the 2025/2026 season has surpassed any year in Ingwelala’s recorded history. The previous rainfall flooding record was the 1999/2000 floods, measuring 923.00mm for the year - already more than twice the previous annual historical average rainfall of 447.80mm. This was surpassed during this past season, with the season totalling a staggering 1,258.50mm - 810.70mm above the 42-year annual historical average. This increased the 43-year annual historical average by 18.90mm, rounding off at 2.81 times more than the previous annual historical average rainfall figures before these recent rains begun.
Please see Figure 1 below, showing the total 2025/2026 recorded rainfall, the previous flooding record year (1999/2000), the most extreme drought period (1991/1992), the 43-year historical average rainfall, and the 42-year historical average (excluding 2025/2026), as compared to extrapolations from the 42-year annual historical average rainfall:
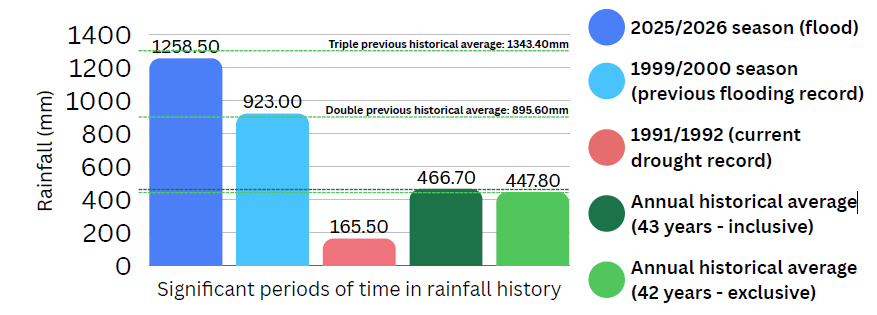 Figure 1: Graph showing significant time periods in Ingwelala’s rainfall history, with annual rainfall as compared to the 42-year and 43-year annual historical average rainfall figures.
To put this into perspective, the change in annual historical average rainfall figures is shown in Figure 2 below, in 10-year increments leading up to the past two years individually. The annual average historical rainfall from the first ten years of data is used as the initial “baseline figure”:
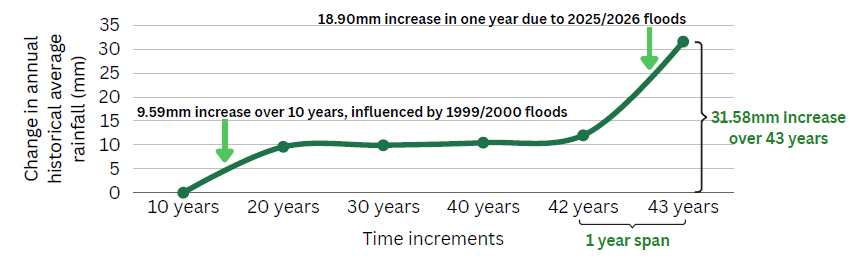 Figure 2: Graph showing the overall change in annual average historical rainfall over time.
Figure 2 shows a dramatic and substantial increase in the annual average historical rainfall, as a direct result of the substantial rainfall recorded in 2025/2026. This will influence all “baseline comparisons” moving forward, with this new benchmark to measure against having been significantly and permanently altered by one year in Ingwelala’s history. This trend also shows that the annual average historical rainfall figure has increased by an impressive 31.58mm overall, indicating that over time the average rainfall experienced in the region has increased, meaning that Ingwelala is getting “wetter” over time.
Although these increased figures are largely due to unprecedented flooding events, the purpose of comparing 10-year time spans allows the data to be compared in a way that also accounts for long-term changes, which still shows an overall increase over time, but at a gradual pace. Flooding events and drought events will naturally have a more substantial impact on overall average figures, however within these 10-year spans it takes an enormously unusual rainfall figure to affect the 43-year historical data in a way that it has been in the 2025/2026 rainfall season. The average change in historical rainfall figures is normally within the range of 0.05-0.50mm over a ten-year span, which is evident in the 20-, 30- and 40-year figures shown in Figure 2 above. During those years, many other floods and droughts were recorded, however they were far less substantial than the rainfall experienced during the 2025/2026 season.
As an example, within the past fourteen years, data indicates that ten of those years recorded higher-than-average rainfall. Within those ten years, there were seven consistent years of substantially higher-than-average rainfall, with recorded floods in 2012, 2013, 2021 and 2023. Within that fourteen-year span, however, the overall effect on average historical figures within that span was still only an increase of 0.54mm - because it takes a truly outstanding event to affect the average figures in a more concentrated or profound way considering the data is averaged over 43 years.
In the coming years, it is expected that a severe drought will be experienced, which will undoubtedly have an effect on the annual average historical figures over time, but probably only minorly reducing the annual average figure by a figure within the “normal” range of 0.05-0.50mm - meaning that it will take decades of data to begin to “normalise” the average, long-term data following the 2025/2026 rainfall season. Therefore, the 1984/1985 season, the 1999/2000 season, the 1991/1992 season and the 2025/2026 seasons can be seen as outliers - indicators of extreme and unusual flooding and droughts, which skew the long-term data more significantly. As a comparison, please see Figure 3 below, showing annual average historical rainfall data with these significant outliers removed from the data set:
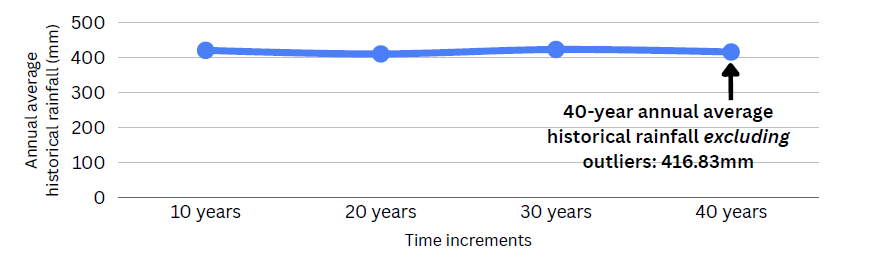 Figure 3: Graph showing annual average historical rainfall figures for Ingwelala, in ten-year increments, with significant flooding and drought outliers removed from the data set
Although the data is not an accurate depiction of Ingwelala’s complete historical rainfall records, with the outliers removed it clearly illustrates how extreme events, such as this past season’s truly spectacular recorded rainfall, can influence how long-term data looks and what impact it can have for any future comparisons. It also gives an insight into what the baseline figures would look like should extreme events not have skewed the data so significantly.
Overall, without these historic and extreme events, the rainfall data for Ingwelala shows that the annual average historical rainfall figure would likely have been in the region of 416.83mm - a substantially lower number than what it is currently, including the outliers, at 466.70mm!
Words by Tess Woolgar. Images courtesy of Tess Woollgar